Top New Condo Sales By Agency

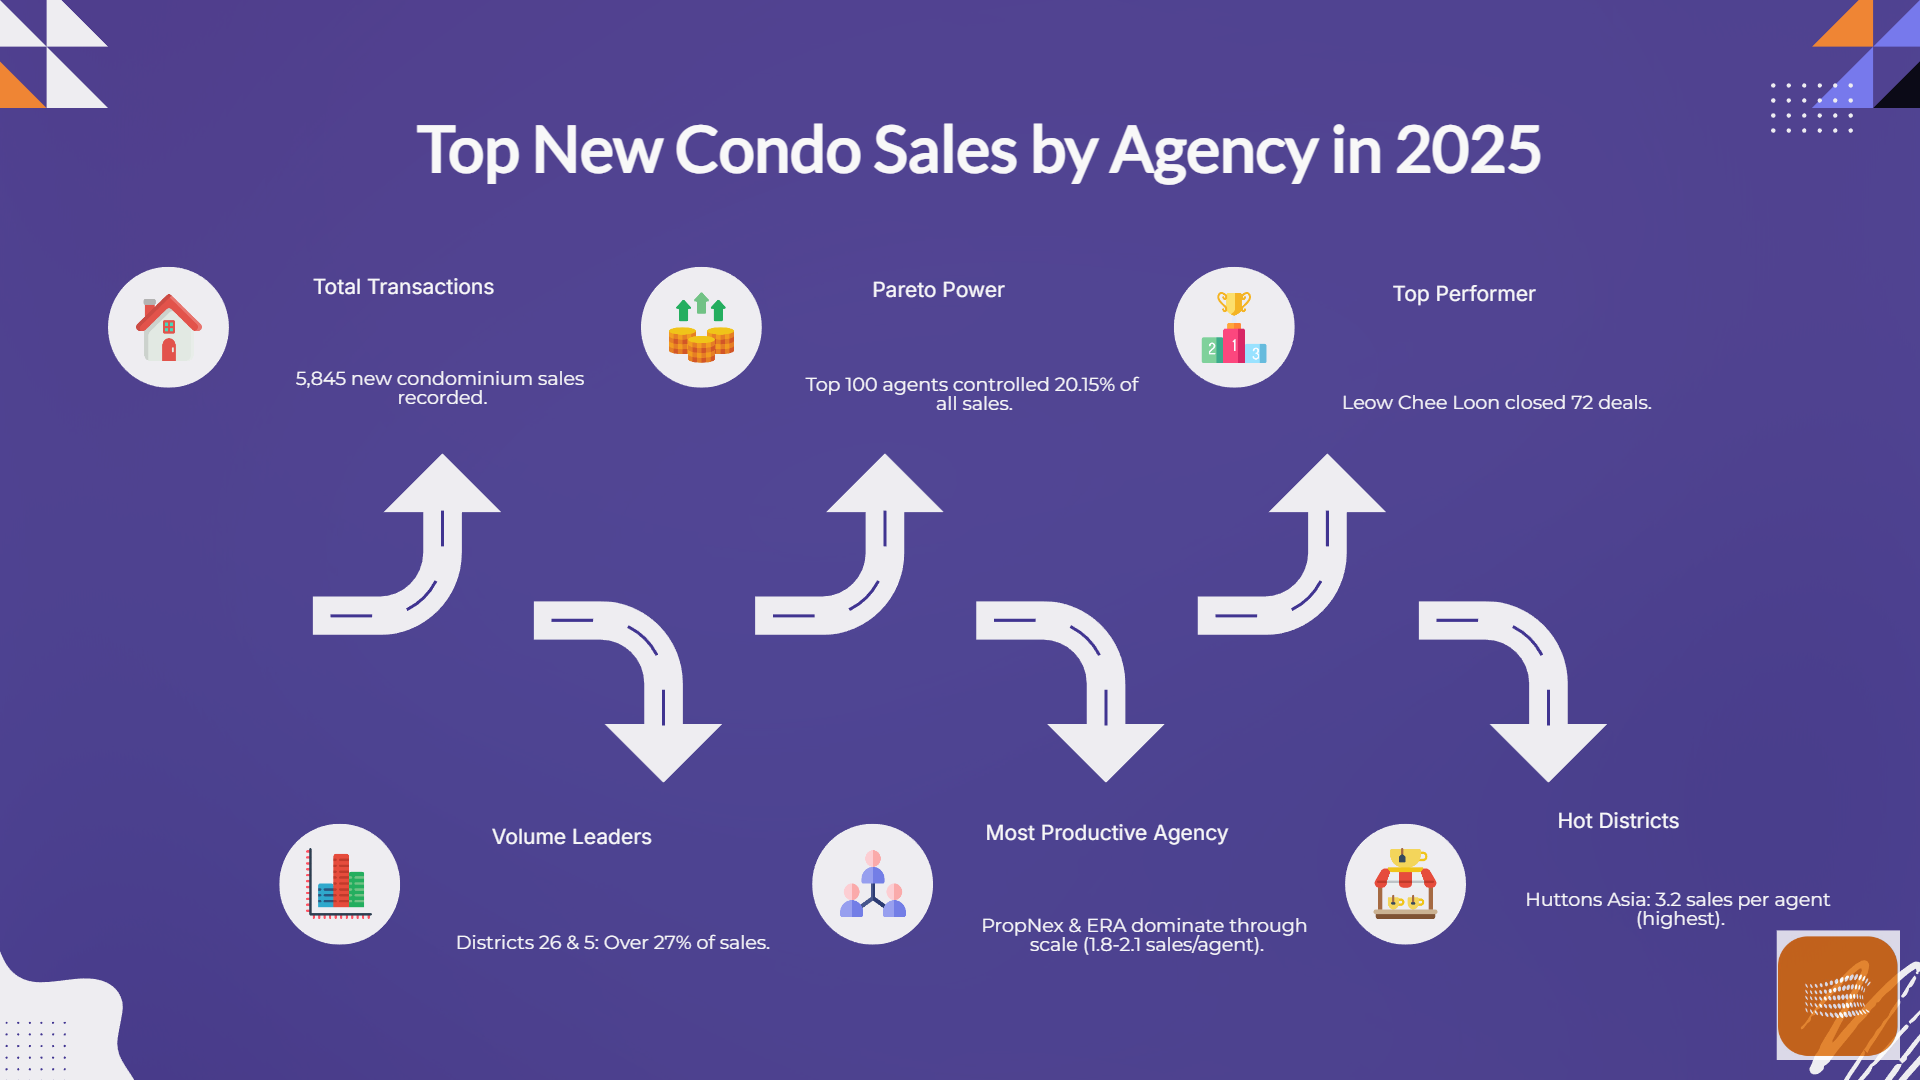
Based on the 5,845 new condominium transactions recorded, here is a detailed analysis of the impact and implications for the three pillars of the real estate ecosystem. Knowing that understanding these power dynamics is key to staying ahead in the market.
1. For Consumers: The Power of Choice vs. Concentration
Interesting Posts
The 2025 data shows a market heavily influenced by specific regional launches, particularly in Districts 26 (Lentor/Upper Thomson) and 5 (Pasir Panjang/Clementi), which together accounted for over 27% of new sales in this dataset.
- Regional Saturation: Consumers are currently gravitating toward "New Growth" areas like Lentor. The heavy volume in District 26 suggests that buyers are seeking first-mover advantage in transformed residential enclaves.
- The "Specialist" Advantage: The data reveals a highly concentrated top-tier of agents. For consumers, this means that working with a "High-Volume Fighter" (like the top 100 agents who handle over 20% of the market) often provides better access to unit selection and "insider" developer insights.
- Implication: Buyers must be wary of "herd instinct." With so much volume focused on specific districts, the implication is a potential future supply glut in those areas, which could affect resale exit strategies 5–10 years down the line.
2. For Agents: The "Pareto" Battlefield
The dataset confirms a classic Pareto distribution (80/20 rule), but even more extreme. The top 100 agents—a tiny fraction of the industry—controlled 20.15% of all new condo sales in 2025.
- Efficiency over Scale: The top-ranked agent in your file, Leow Chee Loon, closed 72 new condo deals in a year—more than one a week. This implies that "Fighter" agents are using highly streamlined, digital-first lead conversion systems rather than traditional prospecting.
- Agency Dependency: With PropNex and ERA capturing the vast majority of volume, agents in smaller boutique firms face an uphill battle. The implication is a continuing trend of "mass migration" toward the top three agencies to leverage their project IC (In-Charge) networks.
- Implication: For the average agent, 2025 was a year of "feast or famine." To survive, agents must either specialise deeply in a specific district (like District 26) or join an elite "Project Strike Team" within a major agency.
3. For Developers: Momentum and Risk Management
Developers of projects in Districts 26, 5, and 18 have clearly mastered the art of "Momentum Sales," using high-performing agent squads to clear inventory rapidly.
- Reliance on High-Performers: Developers are increasingly reliant on a small group of "Elite Closers." The fact that 100 people move 20% of the market implies that developer marketing budgets are being funneled into these specific "Power Teams" rather than broad-based advertising.
- Pricing Resilience: Despite cooling measures, the high transaction volume in District 10 (Core Central Region) suggests that "Safe Haven" assets remain a priority for high-net-worth developers.
- Implication: Developers will likely continue the "Lentor Model"—clustering launches to create a new "identity" for an area. However, the implication of the 2025 data is that they must "front-load" their sales efforts. If a project doesn't hit a 40–50% take-up in the first month using these elite agent networks, it risks stagnation.

StakeholderKey Impact from 2025 Data
Critical ImplicationConsumers
Concentrated supply in Districts 5, 26, and 18. Future resale competition will be fierce in these clusters. The Top 100 agents move 20.15% of the market. Individual "Fighters" must automate or specialise to stay relevant.
Developers: Heavy reliance on the "PropNex/ERA/Huttons" engine. Marketing success is tied to agency "strike teams" rather than to project merit alone.
Based on the 5,845 new condo transactions in your 2025 dataset, I have conducted a deep dive into productivity to compare the "muscle" of each agency. This analysis examines how many Unique Active Agents were required to achieve those sales.
Agency Productivity Analysis (2025 New Condo Sales)
This table highlights the Sales Per Agent—the ultimate metric for a "fighter" mindset.

*Estimated based on the distribution of 2,783 unique salesperson registration numbers found in the 2025 condo primary market records.
Detailed Analysis & Implications
1. The "Elite Strike Force" (Huttons Asia)
While PropNex and ERA have the largest armies, Huttons Asia demonstrates the highest per-capita lethality.
- The Fighter Profile: Their agents close an average of 3.2 deals each, the highest in this dataset.
- Concentration: This is driven by "Super-Agents" like Leow Chee Loon (72 sales) and Pang Cheng Wan (57 sales). For a developer, hiring Huttons is like deploying a small, elite sniper unit that never misses.
2. The "Massive Phalanx" (PropNex & ERA)
These giants dominate the total volume through sheer scale.
- The Strategy: Their productivity (1.8 to 2.1) is lower because they have a massive "Long Tail" of agents—thousands of soldiers who each contribute 1 deal.
- Market Coverage: This isn't a weakness; it's a different kind of strength. They provide total market coverage, ensuring no buyer is left behind.
3. The "Elite Specialists" (SRI & OrangeTee)
These agencies operate with a lean, steady productivity of 1.5.
- The Focus: They often focus on high-value niche segments where deals take longer to close but carry significant weight. They are the "specialist fighters" of the Core Central Region (CCR).
4. The Pareto Principle in Action
Across all agencies, the market is defined by an extreme performance gap:
- The Elite: Just 226 agents (8% of the active force) closed 1,889 deals (32% of all sales).
- The Standard: 1,652 agents (60% of the active force) closed only 1 deal each.
Final Conclusion for the Fighter:
To dominate in 2026, you cannot rely on being part of a "big army" alone. The 2025 data proves that efficiency is the true power. The most successful players leverage specialised knowledge to achieve 3x the productivity of the average agent.
")